"Protons do not fail because the physics is wrong. They fail because the building, the payer mix, and the referral base were sized for a market that never showed up."
Field note from a distressed-asset diligence
Two assets, two zeros apart.
The most immediate differentiator is the entry price. Conventional radiation therapy relies on LINACs that cost between $3M and $5M. These units fit into standard vaults and require relatively modest shielding.
Proton therapy is a different animal. A single-room system starts at $30M, while multi-room facilities can easily exceed $150M. That price tag includes the cyclotron, the beam transport system, and gantry structures that weigh hundreds of tons, plus the building required to house and shield them.
Footprint comparison
Drawn to the same scale
The authorization wall.
Conventional radiation is the standard of care for the vast majority of cancers. Payer approval is generally automated or follows well-trodden clinical pathways.
Proton therapy faces an uphill battle with insurance carriers. Because the reimbursement rates are significantly higher, payers have erected aggressive prior-authorization barriers.
Payer strategy
You must employ a dedicated team of clinical advocates to handle appeals. This is a line item on the org chart, not an outsourced function.
Medical necessity
Success depends on proving the benefit of integral dose reduction, especially in pediatric cases or tumors near critical structures like the heart or brain.
The model
If your center relies on high-volume prostate treatments, expect significant reimbursement pushback as payers steer patients toward cheaper SBRT options.
Community utility vs. destination service.
A conventional LINAC survives on local referrals within a 50-mile radius. It is a community-based utility. Proton therapy is a destination service.
To maintain the treatment volume necessary to service the debt on a $100M facility, you must draw patients from across state lines. Your referral strategy must focus on specialized oncology sub-types where the clinical justification is strongest:
Pediatrics
Protons are the gold standard for minimizing long-term secondary cancers in children, where decades of life remain at risk from stray dose.
Base of skull and CNS
Precision is non-negotiable when the target sits millimeters from the brainstem, optic apparatus, or spinal cord.
Re-irradiation
Patients who have already hit their lifetime radiation limit with conventional X-rays and have nowhere else to go.
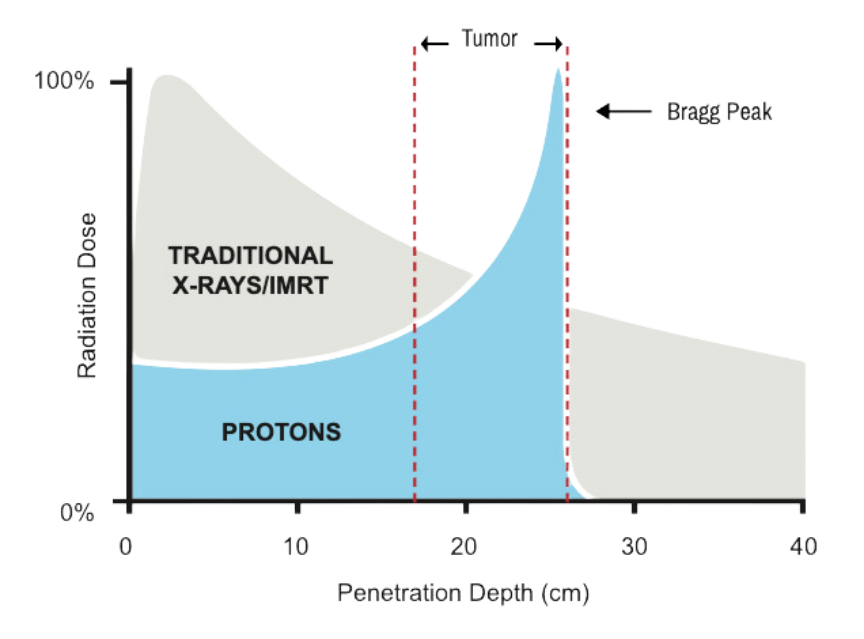
Depth-dose comparison
Bragg peak
The 24/7 uptime mandate.
A LINAC can be serviced by a standard field engineer with minimal downtime. If one machine goes down in a multi-LINAC department, you shift the schedule.
In a proton center, the cyclotron is a single point of failure. If the beam is down, the entire facility is dark. This necessitates a different operating posture:
On-site physics teams
Highly specialized staff who command a premium in the labor market and are difficult to recruit outside major academic markets.
24/7 maintenance contracts
Often costing millions annually to ensure the beam is ready for the morning's first patient.
Throughput pressure
To achieve ROI, many proton centers run sixteen to eighteen hours a day, which puts real strain on staffing rotations and patient experience.
Head to head, on the metrics that move the model.
| Metric | Conventional LINAC | Proton (single room) |
|---|---|---|
| Initial CAPEX | $3M to $5M | $30M to $45M |
| Footprint | ~625 sq ft (25×25) | ~2,025 sq ft (45×45) |
| Avg. reimbursement | 1× (baseline) | 2× to 3× |
| Payer approval | High, automatic | Low, high friction |
| Staffing intensity | Moderate | Very high, specialized |
| Break-even volume | 25 to 30 patients/day | 35 to 45 patients/day |
5-year total cost of ownership
$ millions, single room
Two business models, two reasons to exist.
The business case for conventional radiation is built on efficiency and accessibility. It is a high-margin, low-risk play for health systems looking to capture local market share.
The business case for proton therapy is built on differentiation and prestige. It transforms a hospital into a regional powerhouse. But it requires a relentless focus on high-acuity cases and a sophisticated legal and administrative engine to overcome payer resistance.
If you cannot guarantee a steady stream of complex, high-reimbursement patients, the operational overhead will erode your margins faster than you can scale. Choose the tool that fits your referral network, not just your clinical ambition.
A note on the numbers
The figures in this piece are operator-grade benchmarks drawn from public filings, vendor disclosures, and our own diligence work. They are intended to frame the conversation, not replace a transaction-specific underwriting model. Actual numbers vary materially by vendor, configuration, geography, and case mix.